Understand your dashboard
Today’s sales, the last 7 days, open orders, low stock and what needs your attention.
The Dashboard is the first page you see after signing in.
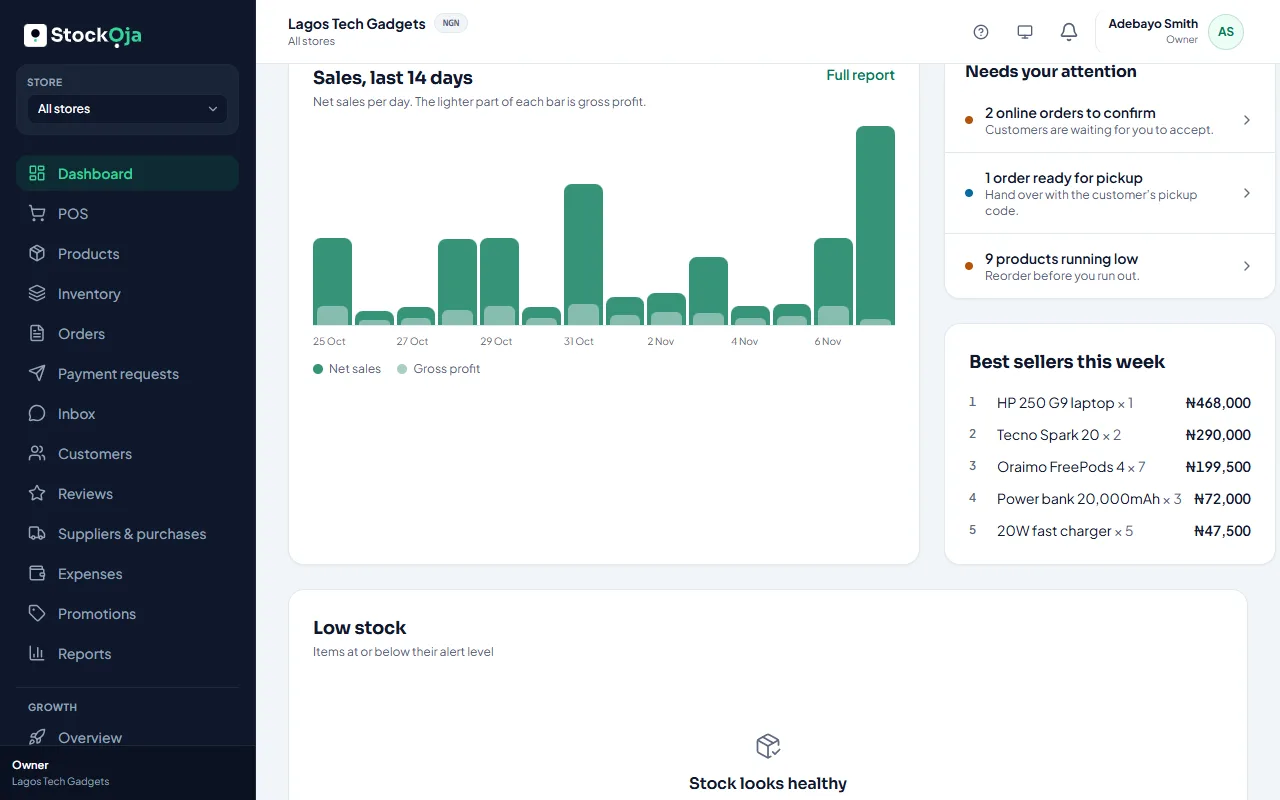
At the top
Today’s sales, compared with yesterday.
Last 7 days, compared with the 7 days before.
Gross profit, 7 days.
Open online orders: how many are waiting and how many are ready for pickup.
Needs your attention
Online orders to confirm, orders ready for pickup, products running low and, if any, an overdue plan payment. When there’s nothing, it says You’re all caught up.
Also on the dashboard
Sales, last 14 days: net sales per day; the lighter part of each bar is gross profit. Select Full report for more.
Best sellers this week.
Low stock: items at or below their alert level.
Expiring stock, if you track expiry dates.
Quick actions, such as Open POS and Add products.
Related articles
- Sales and profit report Net sales, gross profit, expenses and net profit, by payment method, channel and store.
- Low-stock alerts Get warned before you run out, per product and per store.
- Handle online orders Confirm new orders, get them ready, then hand them over or deliver them.
- What StockỌja does and who it’s for One place to track your stock, sell at the counter and online, and see your profit.